Top US Airports to Avoid for International Travel in 2025
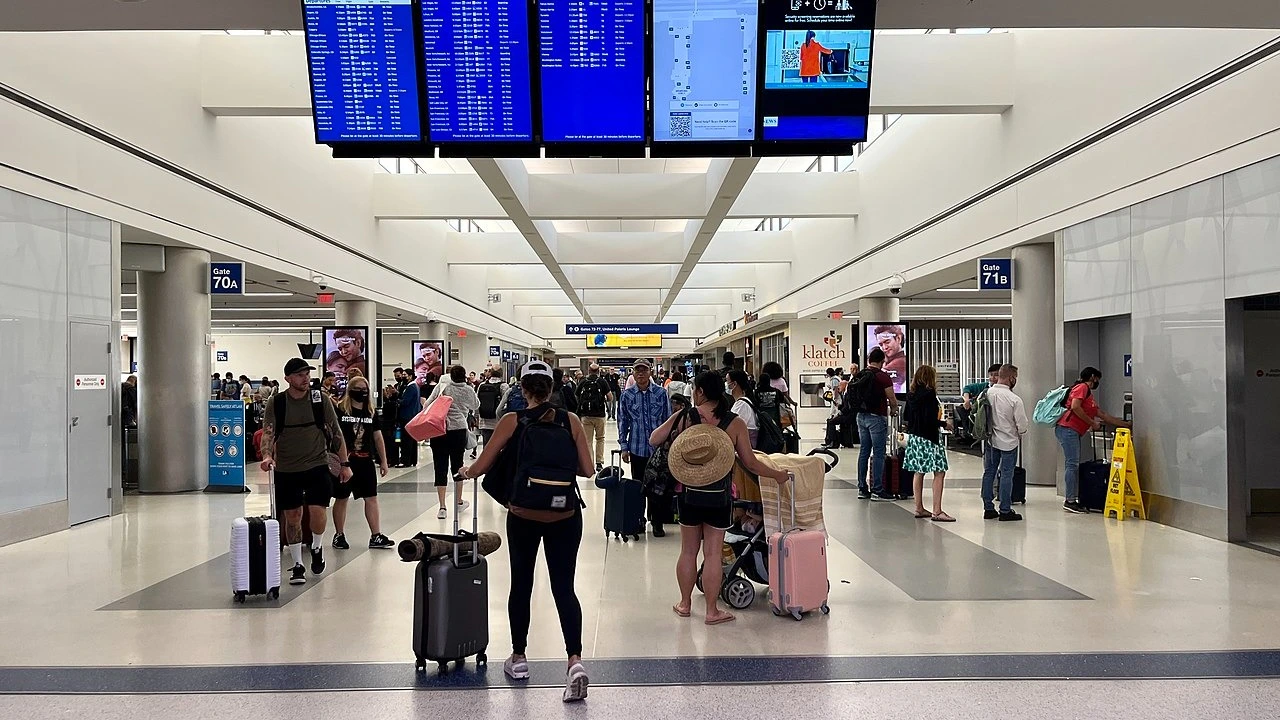
If you’re gearing up for international travel during the 2025 holiday season, your selected arrival airport may greatly influence your overall experience. While the demand for international flights has eased since the post-pandemic surge, U.S. terminals are still expected to be bustling in December.
Although some might think a decline in demand translates to shorter waiting lines, the truth is more complex. Changes in staffing, fluctuating forecasts, and even a slight uptick in arrivals can lead to unexpected delays.
Before setting your travel plans in stone, let’s take a deep dive into data regarding holiday-related immigration and customs wait times. We’ll also share valuable tips for expediting the process.
The Busy Holiday Season
International travel for 2025 shows a steady but modest increase. Travelers are still eager to take trips, especially between Christmas and New Year’s, but not at the same pace as the earlier “revenge travel” phase.
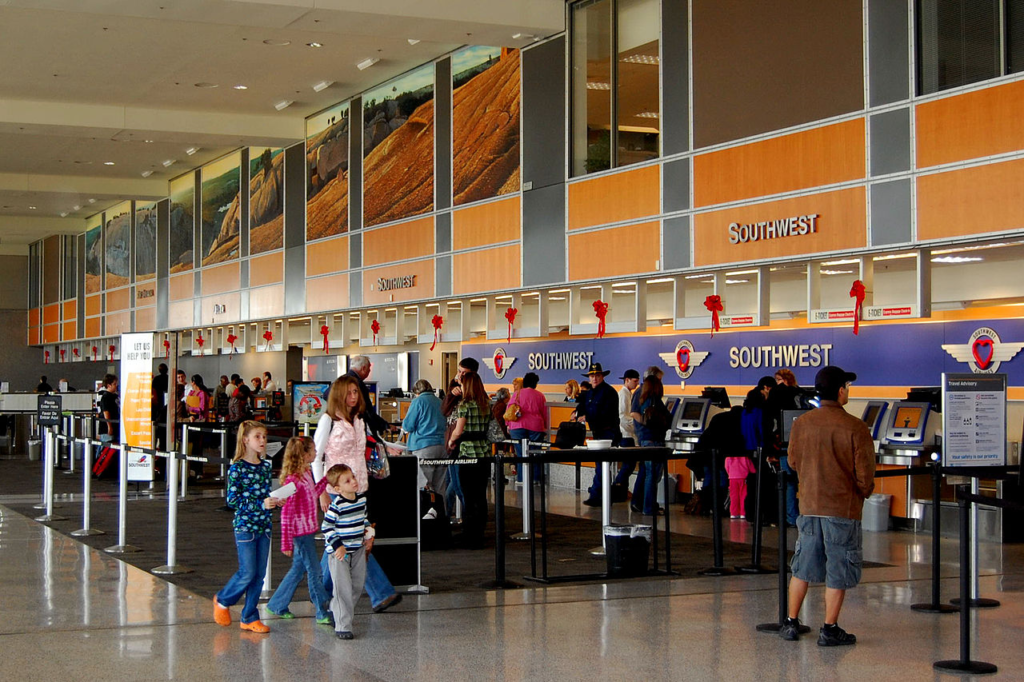
Despite this, airport staffing and resource planning for Customs and Border Protection (CBP) often lag behind actual demand. This situation creates a unique scenario in December: heavy travel periods with varying levels of stress on immigration lines depending on the airport and the time of day. While some airports navigate crowds efficiently, others struggle with longer wait times even when fewer passengers arrive.
Understanding Wait Times
Holiday travel doesn’t always result in daunting wait times. Here are some relevant statistics:
- The average processing time during the 2024 holiday season was 22 minutes.
- Almost half of passengers (45.5%) passed through immigration in 15 minutes or less.
- Only 5.8% experienced waits longer than one hour.
Nevertheless, two pivotal factors can influence your wait time significantly.
1. Arrival Time
Arriving between 5 a.m. and 3 p.m. typically results in about a 26% longer wait compared to later arrivals or those landing overnight.
2. Citizenship Status
Non-U.S. citizens face notably longer waits, averaging 29.8 minutes, while U.S. passport holders can expect around 15.1 minutes.
These differences can substantially impact the fluidity of your arrival experience.

Best and Worst Airports for International Arrivals
CBP keeps track of immigration wait times at 41 key U.S. airports, revealing fluctuations in efficiency. Size doesn’t always equate to speed.
Airports with the Longest Waits
The following airports saw the slowest processing times during the last holiday season:
| Airport | Average Holiday Wait Time |
|---|---|
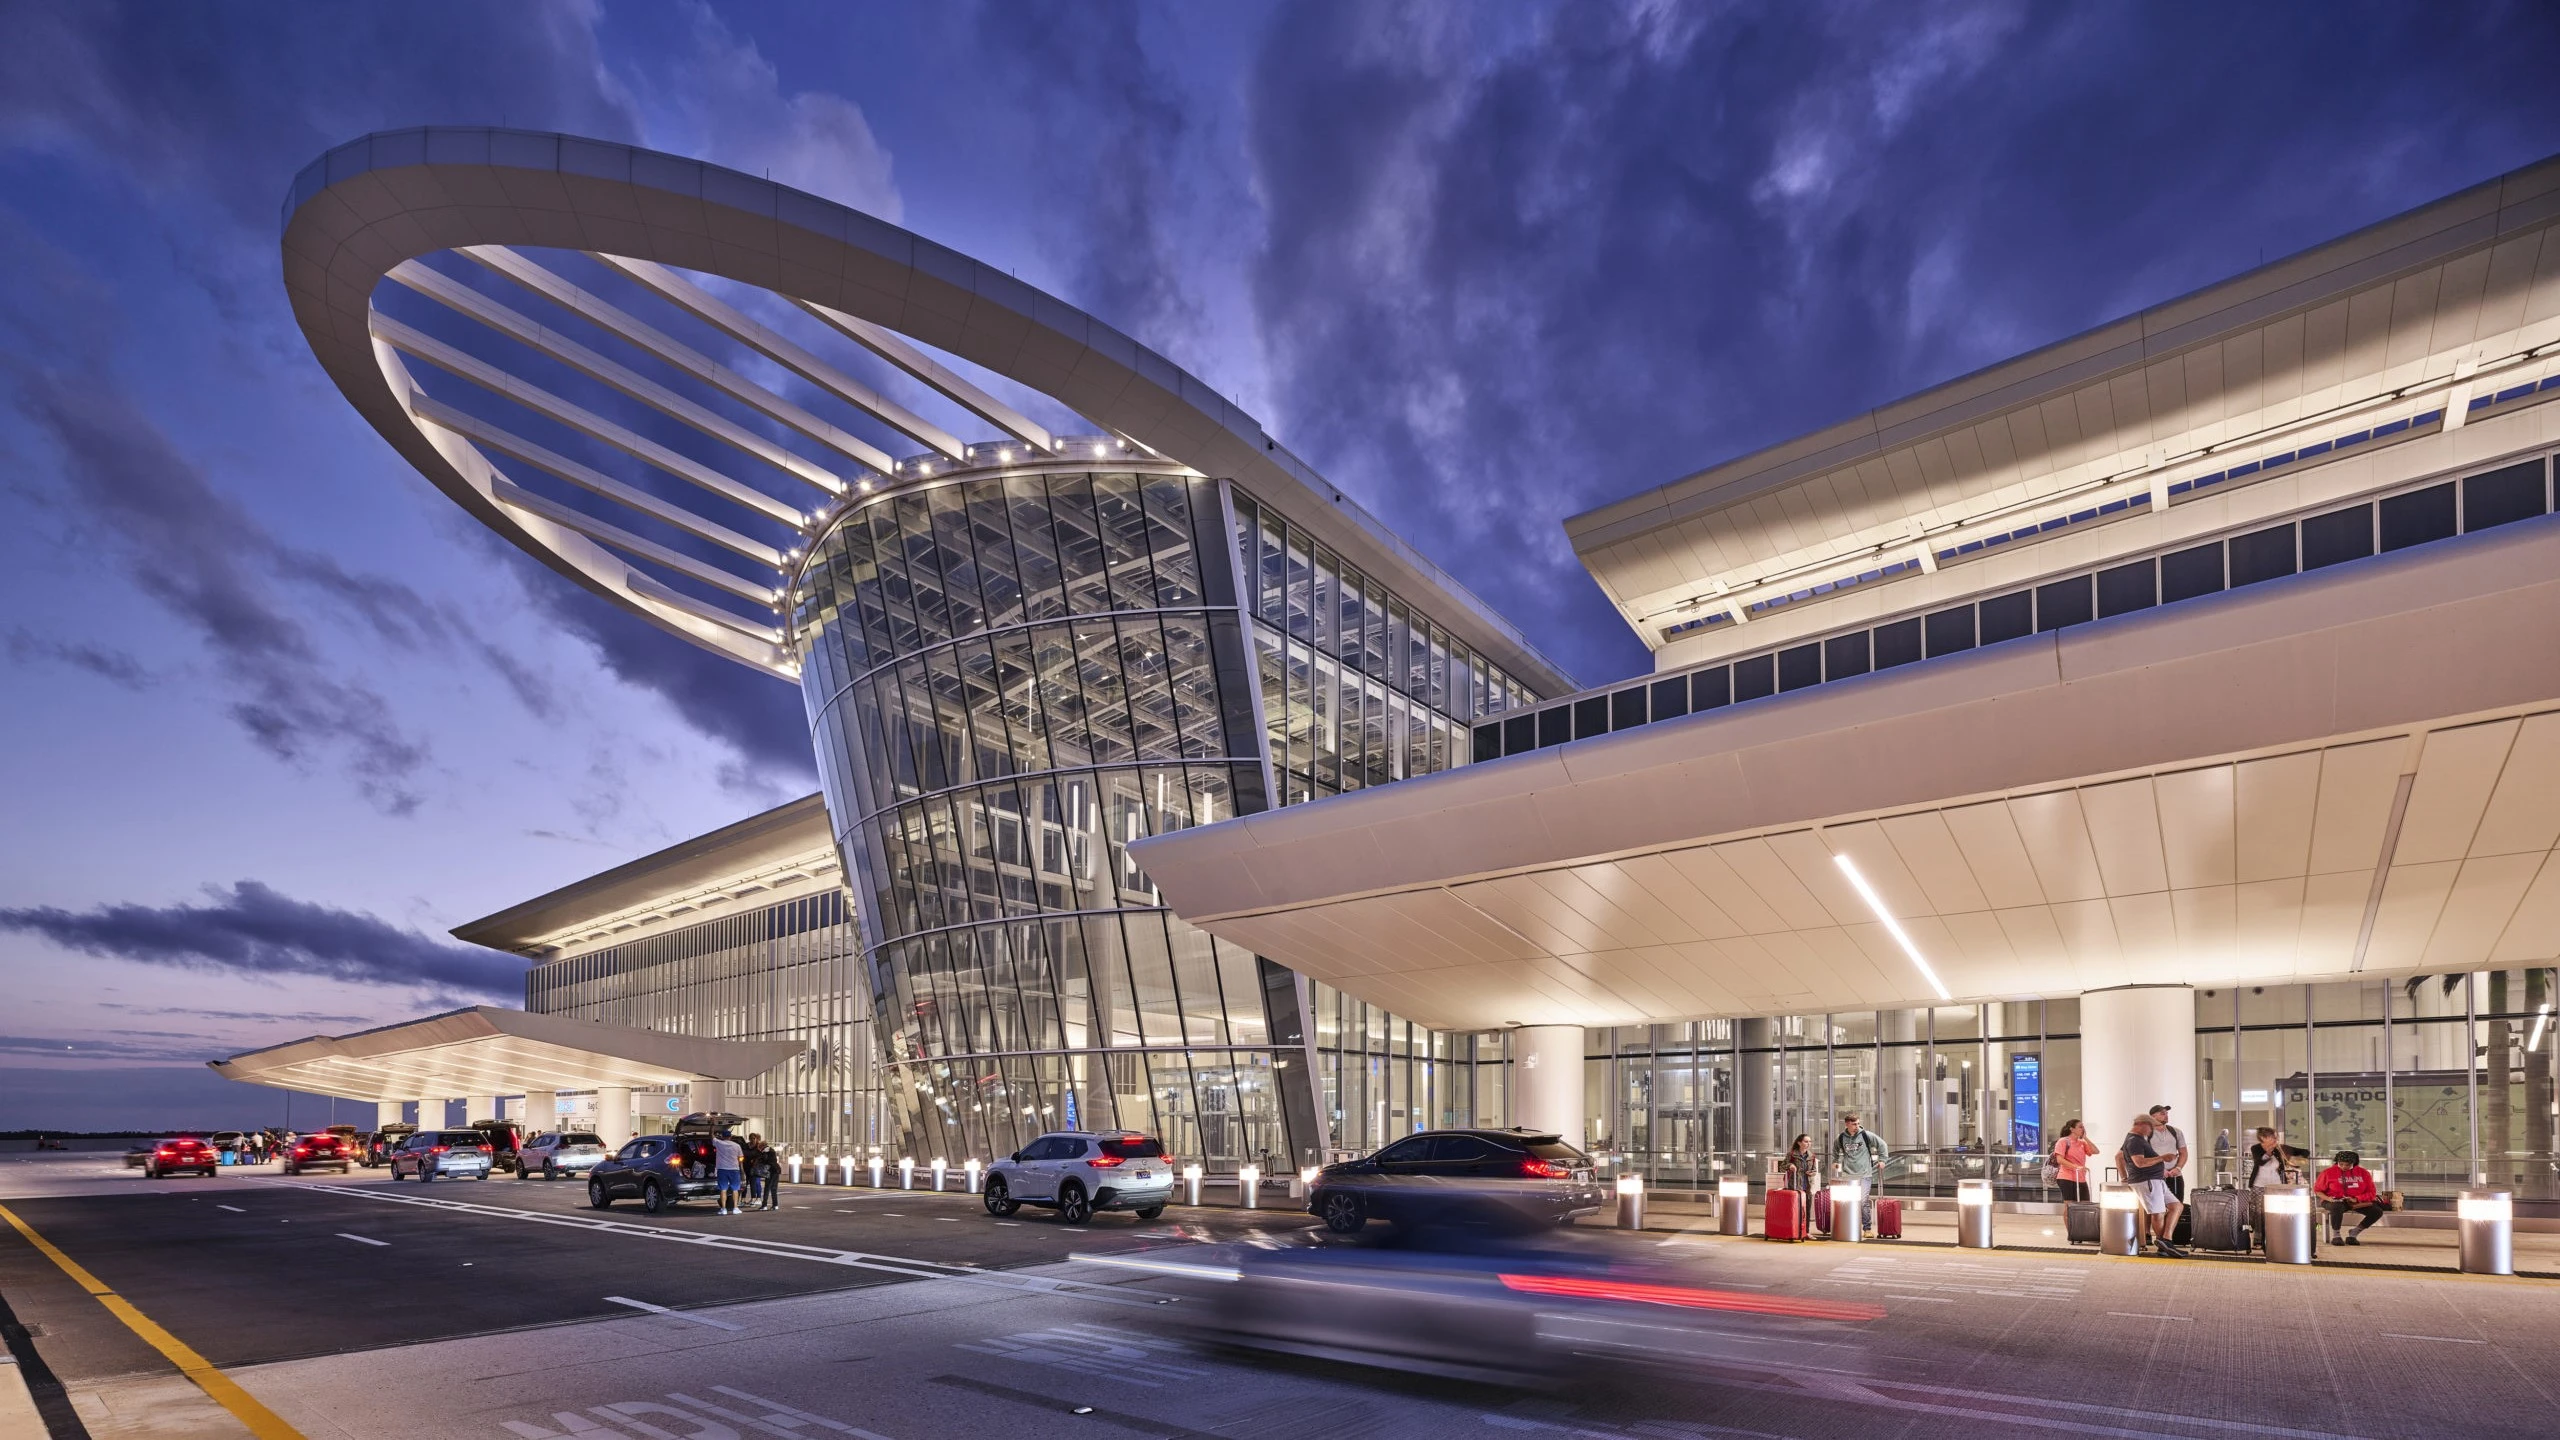
| Orlando (MCO) | 32.7 minutes |
| Los Angeles (LAX) | Among the slowest processing speeds |
| Nashville (BNA) | 27.9 minutes, despite low international traffic |
Orlando and Nashville consistently show high wait times despite differing passenger volumes.
Airports with the Fastest Arrivals
Some airports stand out for their speedy processing times:
| Airport | Average Holiday Wait Time |
|---|---|
| Palm Beach (PBI) | 3.8 minutes |
| John Wayne (SNA) | 4.9 minutes |
| Phoenix Sky Harbor (PHX) | Around 7 minutes |
Phoenix Sky Harbor is particularly impressive, processing nearly ten times the number of passengers as Palm Beach and John Wayne while maintaining one of the shortest wait times in the country.
How to Speed Up Your Arrival
Even if you can’t choose the airport, several strategies can help minimize immigration wait times.
Enroll in Global Entry
This program is one of the quickest ways to complete the U.S. immigration process. The fee is $120 for a five-year membership, and many premium travel credit cards offer reimbursement. Children under 18 can apply for free when accompanying a parent or guardian.
Use the Mobile Passport Control App
This free, CBP-approved app is available at over 30 airports. It allows travelers to skip the main queue for a designated line.
Avoid Peak Arrival Periods
Landing after 3 p.m. can significantly lessen your wait times. Early morning arrivals often face considerable delays.
Keep Your Travel Documents Accessible
Having your passport and confirmation details ready can greatly expedite your experience through mobile passport, Global Entry, or kiosk lines.
Why Your Airport Choice Matters
With notable differences in immigration wait times at the 41 tracked airports—ranging from just under four minutes in Palm Beach to over 30 minutes in Orlando—your choice of arrival airport plays a crucial role.
- Travelers coming from Europe or Latin America often have the flexibility to choose their first point of entry.
- Domestic connections after international flights can often be routed through airports known for quicker processing.
- Those visiting family over the holidays should anticipate longer lines at busy hubs.
In a year where travel demand appears relatively steady, immigration wait times still vary significantly across the United States.
Airport Performance Data
| Rank | Airport Name | Code | City, State | Average Delay (min) | % On-Time | Departure Delay (min) | Arrival Delay (min) | Delay Increase YoY | Cancellation Rate |
|---|---|---|---|---|---|---|---|---|---|
| 1 | Orlando International Airport | MCO | Orlando, FL | 32.7 | 66.9% | 23.1 | 37.4 | 26.1% | 12.6% |
| 2 | Los Angeles International Airport | LAX | Los Angeles, CA | 30.3 | 75.5% | 20.1 | 41.4 | 29.5% | 11.5% |
| 3 | Nashville International Airport | BNA | Nashville, TN | 27.9 | 52.1% | 26.0 | 33.5 | 24.1% | 4.2% |
| 4 | Chicago O’Hare International Airport | ORD | Chicago, IL | 27.3 | 68.4% | 22.7 | 35.2 | 35.6% | 9.1% |
| 5 | Austin–Bergstrom International Airport | AUS | Austin, TX | 26.9 | 58.4% | 23.2 | 34.9 | 33.5% | 5.4% |
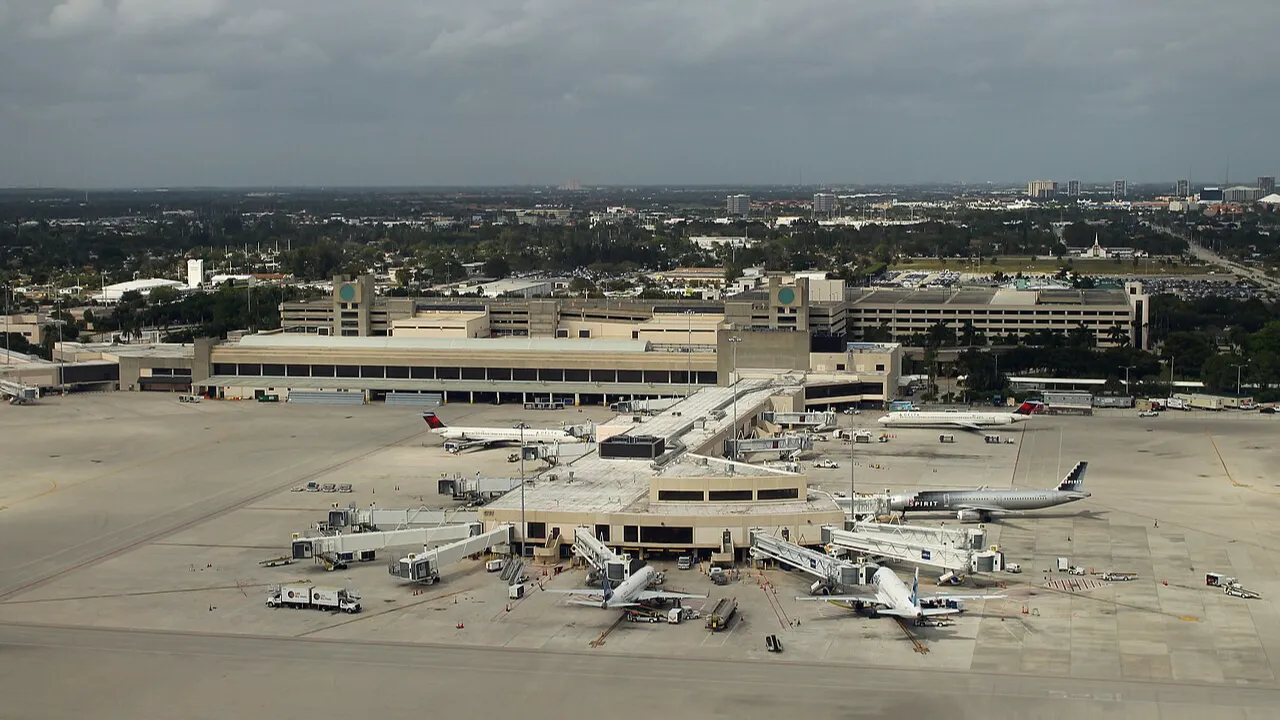
| 6 | Fort Lauderdale–Hollywood International Airport | FLL | Fort Lauderdale, FL | 26.3 | 67.1% | 19.4 | 31.7 | 39.5% | 9.6% |
| 7 | John F. Kennedy International Airport | JFK | New York, NY | 26.1 | 63.7% | 14.6 | 35.2 | 39.7% | 8.5% |
| 8 | Miami International Airport | MIA | Miami, FL | 23.9 | 67.3% | 14.3 | 30.1 | 41.2% | 7.6% |
| 9 | San Diego International Airport | SAN | San Diego, CA | 23.4 | 43.6% | 20.9 | 29.3 | 31.0% | 1.3% |
| 10 | George Bush Intercontinental Airport | IAH | Houston, TX | 23.0 | 62.1% | 17.7 | 29.1 | 41.6% | 5.2% |
Wrap-Up
The holiday season will undoubtedly bring crowded airports and a surge of travelers. However, lengthy immigration delays don’t have to be part of it.
By selecting airports known for efficiency, timing your arrival, and taking advantage of programs like Global Entry or Mobile Passport, you can considerably reduce your waiting time. For many flyers, saving even a brief 15 to 20 minutes can mean the difference between making a transfer smoothly or rushing through the terminal.
As you prepare for your 2025 holiday travels, consider more than just flight times and prices; your arrival airport may hold the key to a more pleasant journey. What strategies will you employ for a smoother traveling experience?